Rosa Jenkins · 25 October 2026
Decoding Pollinator Migration Pathways Through Layered Data Overlays in Virtual Grassland Environments
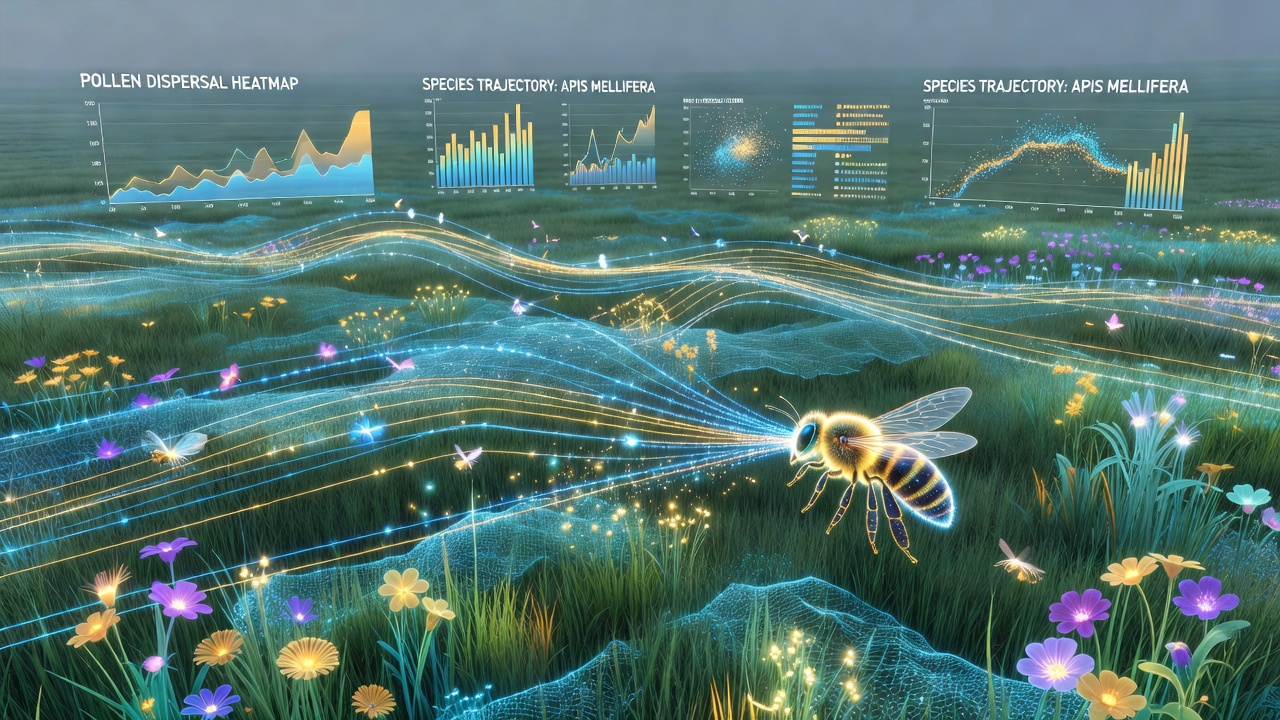
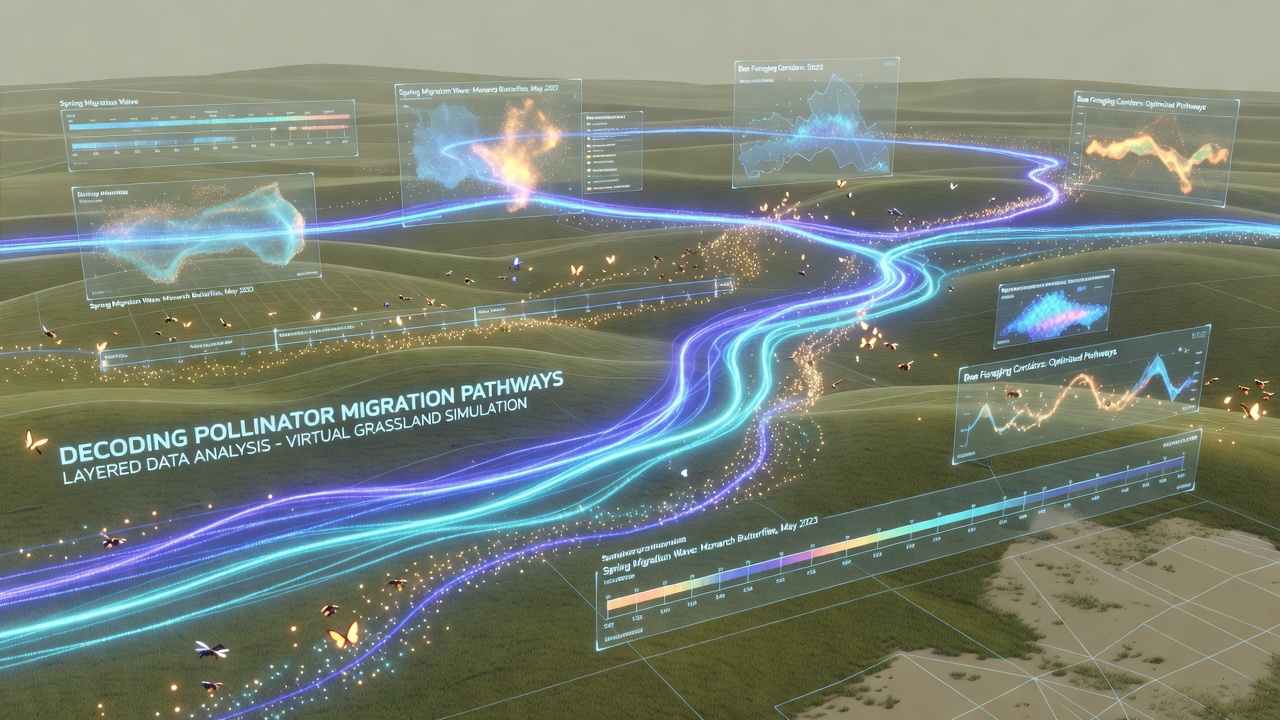
Researchers combine satellite imagery, ground-based sensor networks, and individual insect tracking tags to build virtual grassland environments that reveal migration routes for pollinators such as bees and butterflies, and these models integrate climate variables, vegetation density, and wind patterns into single interactive platforms. Data from multiple sources stack as transparent layers so analysts can isolate factors that influence route selection at different times of year, while algorithms adjust opacity and color to highlight correlations that remain hidden in traditional two-dimensional maps.
Data Sources Feeding the Models
Agencies collect raw inputs from weather stations across North America, Europe, and Australia, then feed those readings into simulation engines that recreate seasonal grassland conditions, and the United States Geological Survey maintains open datasets on land cover change that researchers merge with European Environment Agency vegetation indices. Tagging programs attach miniature radio transmitters to monarch butterflies and bumblebees so their GPS coordinates update every few minutes during active flight periods, and those position logs become point clouds that algorithms convert into continuous path lines once uploaded to the virtual environment.
Layer Construction and Interaction
Each data category occupies its own overlay that users can toggle independently or combine through arithmetic operations, and one layer might display soil moisture levels while an adjacent layer shows flower bloom timing derived from multispectral satellite passes. Analysts adjust the sequence of layers so wind direction data sits directly above temperature gradients, which allows the software to calculate energy expenditure for hypothetical flight paths, while collision detection routines flag areas where high winds intersect low nectar availability. The system records every adjustment so later review sessions can replay how specific layer combinations altered predicted migration corridors.
Virtual Environment Rendering
Rendering engines generate three-dimensional grassland scenes at scales ranging from individual meadow patches to entire bioregions, and texture mapping applies real-time updates when new sensor data arrives, which keeps vegetation height and flower density current within the simulation. Users navigate these spaces through desktop interfaces or head-mounted displays so they can follow a tagged pollinator along its recorded route while simultaneously viewing supporting data layers projected as floating planes. Collision and occlusion algorithms prevent visual clutter when many layers activate at once, and color gradients shift automatically to maintain readability across different lighting conditions inside the virtual space.
October 2026 Data Integration Milestone
In October 2026 a multi-institution project will release synchronized datasets that cover the full North American monarch migration corridor for the previous three seasons, and participating researchers plan to import these records directly into existing virtual grassland platforms so comparative analyses can run across multiple years without manual reformatting. The release includes standardized metadata tags that align with existing layer structures, which reduces preprocessing time for teams already working inside the simulation environments.
Analytical Techniques Applied to Overlays
Machine learning classifiers scan stacked layers to identify recurring spatial patterns that precede route shifts, and one classifier might flag sequences where drought indicators rise above a threshold while bloom timing lags, then mark those locations as potential bottlenecks. Network analysis tools treat each recorded flight segment as an edge in a graph so centrality measures reveal which grassland patches serve as critical stepping stones, while sensitivity testing removes individual layers to measure how much predictive accuracy declines. Observers note that the removal of wind data produces larger errors than removal of temperature data in most tested corridors.
Applications in Conservation Planning
Land managers import optimized migration pathways from the virtual models into geographic information systems that guide habitat restoration priorities, and those pathways help identify parcels where new wildflower strips would most effectively connect fragmented corridors. State agencies in multiple regions have begun cross-referencing model outputs with existing conservation easements so they can target acquisition funds toward patches that appear repeatedly in high-traffic simulations. The same layered approach also supports scenario testing when proposed infrastructure projects threaten existing routes, because planners can add proposed barriers as new data layers and immediately observe how pollinator paths adjust.
Conclusion
Layered data overlays inside virtual grassland environments continue to expand the resolution at which researchers can examine pollinator movement, and ongoing integration of new sensor streams plus scheduled data releases keep the models current. The approach supplies a shared workspace where field observations, remote sensing products, and simulation outputs coexist so decisions about habitat protection rest on traceable combinations of evidence rather than isolated datasets.